
Team
यह पेज अभी हिंदी में उपलब्ध नहीं है, इसलिए अंग्रेज़ी में दिखाया गया है।
Reports > Team answers “who is doing well, who needs help, and is my staffing right?” It replaced the old Employee Analytics page.
Open Team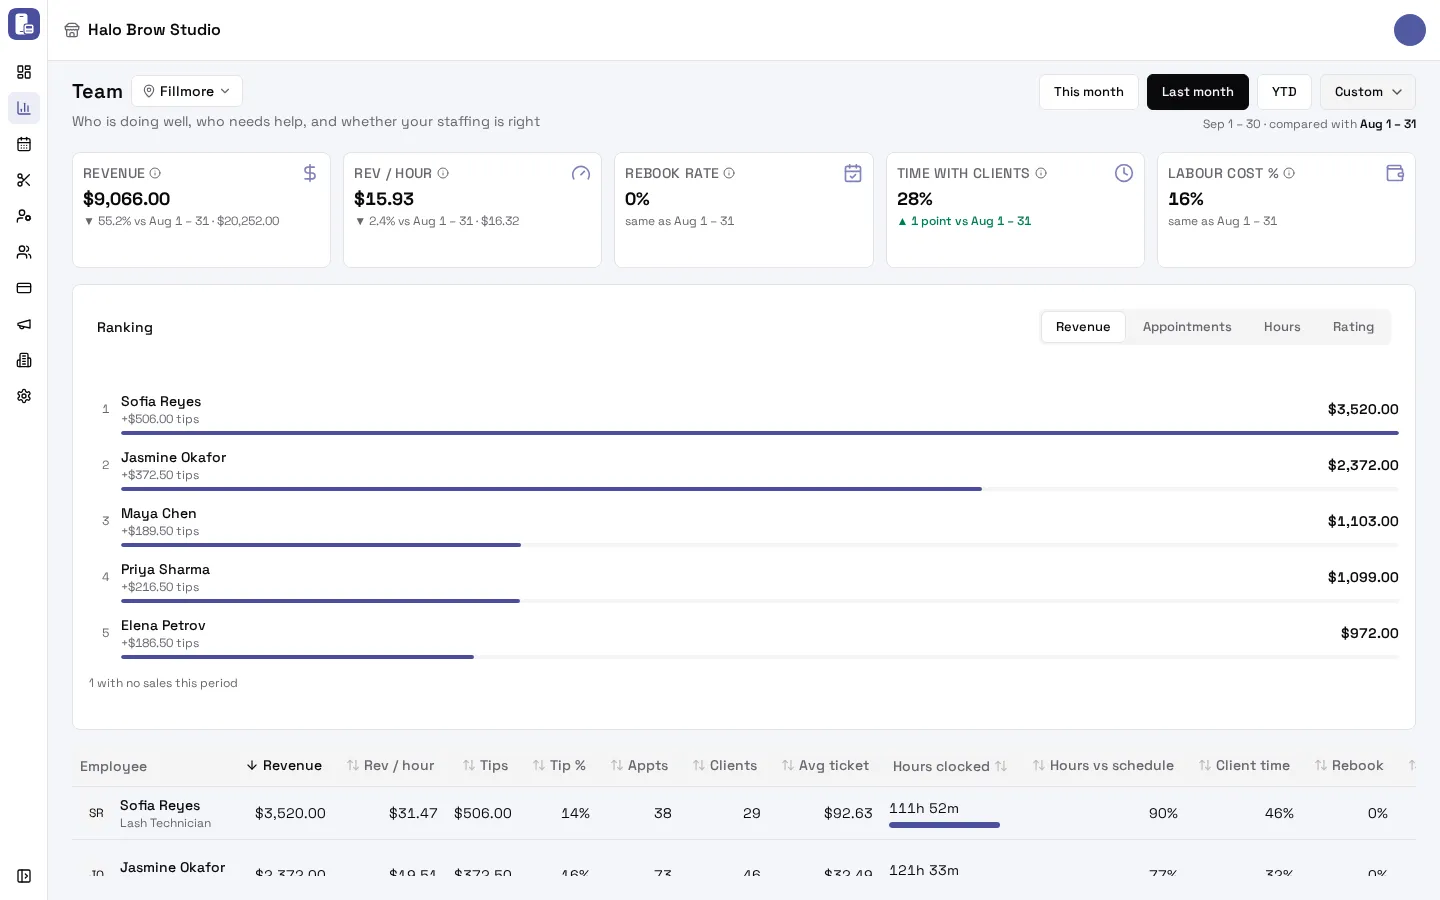
Pick the range and location at the top, as on Sales.
What do the tiles mean?
Section titled “What do the tiles mean?”| Tile | Meaning |
|---|---|
| Revenue | The team’s sales after refunds, without tips (the same as on Sales) |
| Rev / hour | Service sales per hour clocked |
| Rebook rate | Share of clients who have a next visit booked |
| Time with clients | Share of clocked hours spent with clients |
| Labour cost % | Team pay (wages, commission and tips, less booth rent) as a share of revenue. Only for members allowed to manage staff |
Per-hour figures only count people who clock in, and need at least an hour clocked. Otherwise the tile shows a dash (–) with the reason (for example “Too few clocked hours to work out”).
How do I compare staff fairly?
Section titled “How do I compare staff fairly?”- Ranking: rank by Revenue, Appointments, Hours or Rating. The top five show first; Show all lists everyone.
- The table (on a computer): Revenue, Rev / hour, Tips, Tip %, Appts, Clients, Avg ticket, Hours clocked (with a bar against the schedule), Hours vs schedule, Client time, Rebook, New back (new clients who came back), On time and Rating. Click a column to sort. Hover a column name for its meaning.
- On a phone: one card per person, highest revenue first.
Rev / hour is the fairest way to compare full-timers and part-timers.
What do the coloured chips mean?
Section titled “What do the coloured chips mean?”Amber chips are worth a look, green ones are good news:
- Hours, no sales: clocked in, but no sales credited to them.
- Low rebook rate: 10 points under the team.
- Often late: under 80% of shifts started on time (within 5 minutes).
- Little client time: under 35% of clocked time with clients.
- Rating below team: 0.3 stars or more under the team’s average.
- Missing clock-out: a clock-in was left open (fix it in Work history).
- Top rebook rate and Most improved (revenue up 10% or more).
How do I see one person’s numbers?
Section titled “How do I see one person’s numbers?”Click (or tap) a name. Their page has their revenue, revenue per hour, rebook rate, time with clients, tips, appointments and clients, average ticket, hours, new-client return rate, on-time rate, rating, no-show rate (and labour cost % if you may see pay), each compared with the period before. Below: Earnings trend, Service mix, Client mix and Rebook and on time over time.
How is a person’s revenue counted?
Section titled “How is a person’s revenue counted?”A person’s revenue is their share of what their services brought in, after discounts and refunds, without tips. When two people work on one service, it’s split between them. Team totals count each visit and client once.
Troubleshooting
Section titled “Troubleshooting”Someone shows a dash (–) everywhere
Section titled “Someone shows a dash (–) everywhere”They had nothing in the range (often front desk staff who don’t clock in or take services).
Rev / hour or Time with clients looks wrong
Section titled “Rev / hour or Time with clients looks wrong”These depend on clocked hours. Missing clock-outs count 0 hours, and people who don’t clock in are left out. Fix hours in Work history. “More client time than clocked: clock-outs may be missing” means exactly that.
I don’t see Labour cost %
Section titled “I don’t see Labour cost %”It needs permission to manage staff (pay is private). With All locations, you need it at every location.
Can I export the team numbers?
Section titled “Can I export the team numbers?”Use Reports > Sales > Details > Staff and press Export CSV. It has the same per-person figures. See How do I export my sales?